Sniffing Server:
The sniffing server is the machine that will be devoted to gathering wireless traffic information in a given area. The sniffing server has two main modes of operation, Interactive, or Daemonized. In Interactive mode, the program launches a ncurses window that has features of seeing real-time data of wireless activity, among other info. In Daemonized mode, the program launches the data gathering loop in the background, mainly for the purpose of running along with the Server mode that'd enable external polling server to periodically poll and gather collected data. Note that to be able to transmit collected data, you will need another device (such as ethernet) for allowing polling server to contact and retrieve info.
Note: The Interactive Mode is primarily for the purpose of demonstrating the data that AirTraf is capable of gathering. Also, the GUI for the ncurses has been adopted heavily from IPTRAF, and I would like to give credits to Gerald Paul Java for the excellent graphical user interface.
The following are some screenshots of AirTraf sniffing server in Interactive mode:
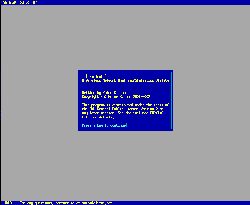
Introduction Screen
|
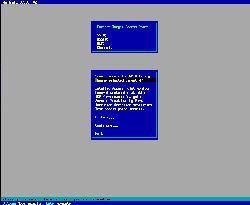
*NEW* Main Menu Screen
|
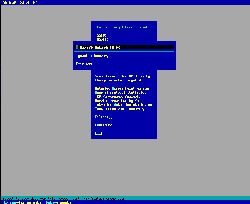
Main Menu Access Point Selection Screen
|
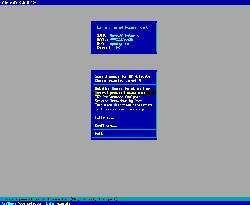
Main Menu 'Ready' Screen
|
Now AirTraf has support for cisco aironet as well as prism2 (Host-AP driver), therefore, due to aironet's ability to sniff on all channels at once, and prism2's inability to do the same, there's two different mode of channel scan feature.
The first mode (Complete) is for Aironet, and it is by far the easier of the two. It just opens socket, and listens...
The second mode (Incremental) is for Prism2, and it basically loops through availble channels over and over again. It relies on wireless extension ioctl calls to make the channel switch.
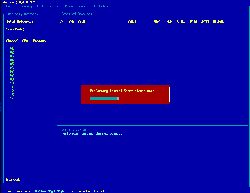
Channel Scanning Initialization
Channel Scannning Screen: AIRONET
|
Channel Scanning Screen: PRISMII
(note the red box, it moves to show the
current channel being scanned)
|
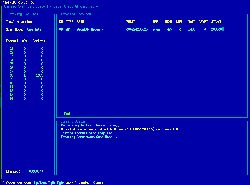
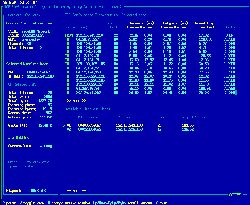
Below is your familiar Detailed Access Point Monitor, formerly known as Wireless Traffic Monitor, as well as the General Protocol Analysis. Each are self explanatory as to what they do...
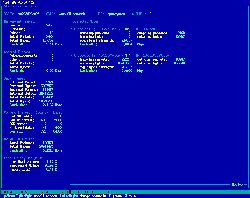
Detailed Access Point Monitoring Screen
|
General Protocol Analysis Screen
|
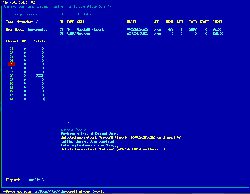
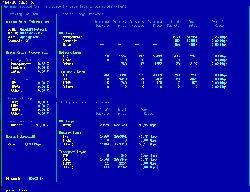
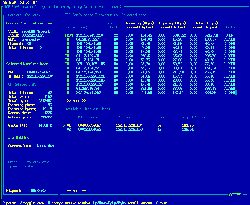
Now here comes the completely NEW stuff! The TCP Performance Analysis tool! Basically now AirTraf is capable of tracking TCP connection related info purely via sniffing on packets going to/from our detected wireless nodes, gathering many interesting statistics.
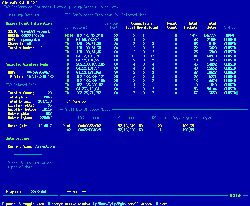
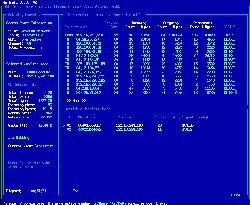
The TCP Performance Analysis has 4 different view modes, one is for Connections (keeping track of open connections, closed connections, etc.), another for Statistics (incoming/outgoing count/byte, as well as retransmission count/byte), another for Latency (incoming/outgoing latency, as well as total observed RTT), and the last for Bandwidth (incoming/outgoing bandwidth, as well as total rate seen divided into current & highest observed).
TCP Performance Analysis : Connections
|
TCP Performance Analysis : Statistics
|
TCP Performance Analysis : Latency
|
TCP Performance Analysis : Bandwidth
|
Polling Server:
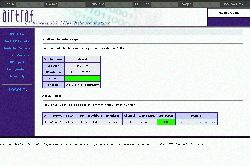
The polling server is the server that periodically polls the sniffing servers to acquire data, and insert the collected data into the database. The polling server comes with a tool called "init-airtraf" which is geared to be used prior to running the polling server, and serves in properly creating & initializing the tables for use by airtraf polling server in the database. There is no graphical mode for the polling server, but there will be graphical web interface for viewing and accessing the gathered data in the database.
Unfortunately, this portion of the project is not being released to the general public at this time. However, if anyone is interested in running through a demo, then please contact me. Serious inquiries only please...
But I suppose few screenshots can't hurt... :)
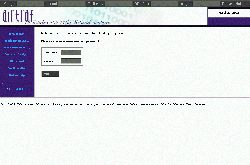
Login Screen
|
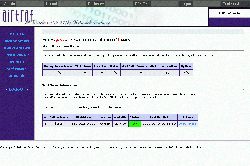
Main Overview Screen
|
Sniffer Details Screen
|
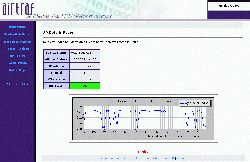
AP Details Screen (w/plotting)
|
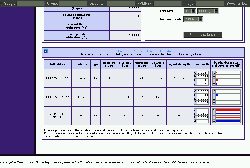
Connected Wireless Nodes Screen
|
|